This is a complete example using C. The idea is to tap into the E1 without disturbing it, decode MTP-2 on the Corelatus probe, send the decoded packets to my workstation and then use wireshark to decode the higher layers and provide a GUI.
| OSI Layer | SS7 Protocol | How do we do it? |
|---|---|---|
| 4. Application | ISUP | Wireshark |
| 3. Network | MTP-3 + SCCP | Wireshark |
| 2. Data Link | MTP-2 | Corelatus probe |
| 1. Physical | MTP-1 (E1) | Tap into the E1 |
Layers 4 & 3: Wireshark
Wireshark is a popular and freely available program for debugging all sorts of protocols. Most people use it for sniffing IP protocols running on ethernet, but it has good SS7 support too. Wireshark can decode the ISUP, SCCP and MTP-3 parts of the SS7 stack.
To get wireshark to display our data, we need to save it in a format wireshark understands. Wireshark's main file format is 'libpcap', the same one tcpdump and tcpflow use.
The Libpcap format is clean and simple, just a short header at the start of the file and then a timestamp and length before every packet. It's documented on the wireshark wiki.
Layer 2: The Corelatus probe
The E1/T1 probe can decode MTP-2 and send the MTP-2 signal units (packets) to my workstation over a TCP socket. To get it to do that:
          <new>
          <mtp2_monitor ip_addr='172.16.2.1' ip_port='4444'
          esu='yes'>
          <pcm_source span='1A' timeslot='16'/>
          </mtp2_monitor>
          </new>
That tells the probe to listen to pcm1A, timeslot 16 and send the signal units on a TCP socket to 172.16.2.1 (my workstation), port 4444. Since I want to troubleshoot a problem, I also want errored-signal-units (ESUs) saved.
netcat can dump the data to a file:
netcat -l -p 4444 > mtp2_capture.raw
That file will have a 12 byte header in front of every signal unit (packet). To turn that into a libpcap-style file, discard everything except for the timestamp and length.
Layer 1: Configuring the probe
This command sets up layer 1:
          <set name='pcm1A'>
          <attribute name='status' value='enabled'/>
          <attribute name='monitoring' value='true'/>
          </set>
pcm1A is the name of the first E1 interface on a probe (there are 16, pcm1A, pcm1B, pcm1C, pcm1D, pcm2A, ... pcm4D).
Setting monitoring to true tells the probe to expect a -20dB (i.e. weak) signal on its E1 input. That's because the probe is connected to the E1 line through a -20dB monitor point. More about that below.
The defaults are fine for the other settings, since SS7 on a 2Mbit/s E1 always uses doubleframe and HDB3. For T1, we'd need to change some values.
That takes care of the software. Finally, we need to actually connect to the E1 without disturbing it.
Tapping into the E1
There's a standard way to tap into an E1: an ITU-T G.772 protected monitor point. It gives you an attenuated copy of the signal on the E1 so that you can listen in without disturbing the live link. Some equipment, e.g. an Ericsson AXE with an SS7/E1 line card, has an inbuilt monitor point. Or you can plug in a monitor point at a cross-connect.
Many sites run all E1s through a MUX or a DXC, that way you can configure the DXC to give you a copy of the timeslots you're interested in on a separate E1 instead of using a monitor point.
If you use a monitor point, you need to tell the probe that the signal is attenuated. That's what the <attribute name='monitoring' value='true'/> line above does. Leave it out if you're using a DXC.
Ready to go C code
save_to_pcap.c is included (with supporting files) in gth_c_examples.zip or, if you prefer, on github. It compiles and runs on Windows and Unix-like systems. It's a complete command-line driven way to capture SS7 from E1 and SDH. Several sites use it to capture SS7 for extended periods.
Wireshark and tshark support reading packets from a pipe, so you can watch packets on the wire live by piping from save_to_pcap:
          >./save_to_pcap 172.16.1.10 1A 2A 16 - | tshark -i -
          capturing packets, press ^C to abort
          saving capture to stdout
          Capturing on -
          0.000000              ->              MTP2 FISU
          0.956000            1 -> 2            ISUP(ITU) IAM (CIC 0)
          0.956000            1 -> 2            ISUP(ITU) ACM (CIC 0)
The same thing works for wireshark:
>./save_to_pcap 172.16.1.10 1A 2A 16 - | wireshark -k -i -
On windows, you can watch live captures by using 'named pipes', like this:
          start save_to_pcap 172.16.1.10 1A 2A 16 \\.\pipe\ss7.1
          wireshark -k -i \\.\pipe\ss7.1
Erlang sample code
We also have equivalent code in Erlang, a niche language we first used at Ericsson.
save_to_pcap.erl is included in (and uses other modules from) gth_erlang_api.zip. It's also on github.
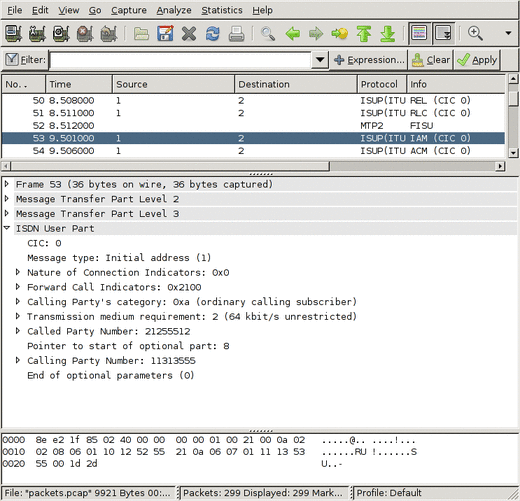
An SS7 ISUP capture file to look at in Wireshark
This file was made by save_to_pcap.c, connected to a Corelatus GTH 2.1, listening to an E1 connecting two load generators configured to start several calls per second. You can view it with Wireshark.