Finding the bad link in an SDH network using BIP counters
Posted June 15th 2017
SDH/SONET has relatively powerful mechanisms for detecting transmission errors, far better than E1/T1 lines. We can use those mechanisms to figure out which optical link in a network has errors. This post shows which parts of the network can see errors in various cases—and which parts cannot.
SDH error detection and counters
SDH packs data into virtual containers (VCs). VCs can be nested, for instance an E1 is transported using a VC-12 and up to 63 VC-12s can in turn be packed together into a larger container called a VC-4. Each of those containers has parity bits so that the receiver can see if the data was damaged in transit. These parity bits are called a bit interleaved parity (BIP).
Each add/drop multiplexor (ADM) in an SDH network keeps count of the number of errors in each BIP it checks. Normally, the ADM will only check the BIP in a container it unpacks or re-packs. Each ADM also sends reports of the BIP error counts backwards on each link. Such a report is called a remote error indication (REI).
By looking at BIP counters and REI counters in various parts of the network, we can reason about the likely source of transmission errors.
A concrete example: case 1
On the left side of this network, we have 15 E1s. They are transported along the light blue path over to the right side of the diagram:
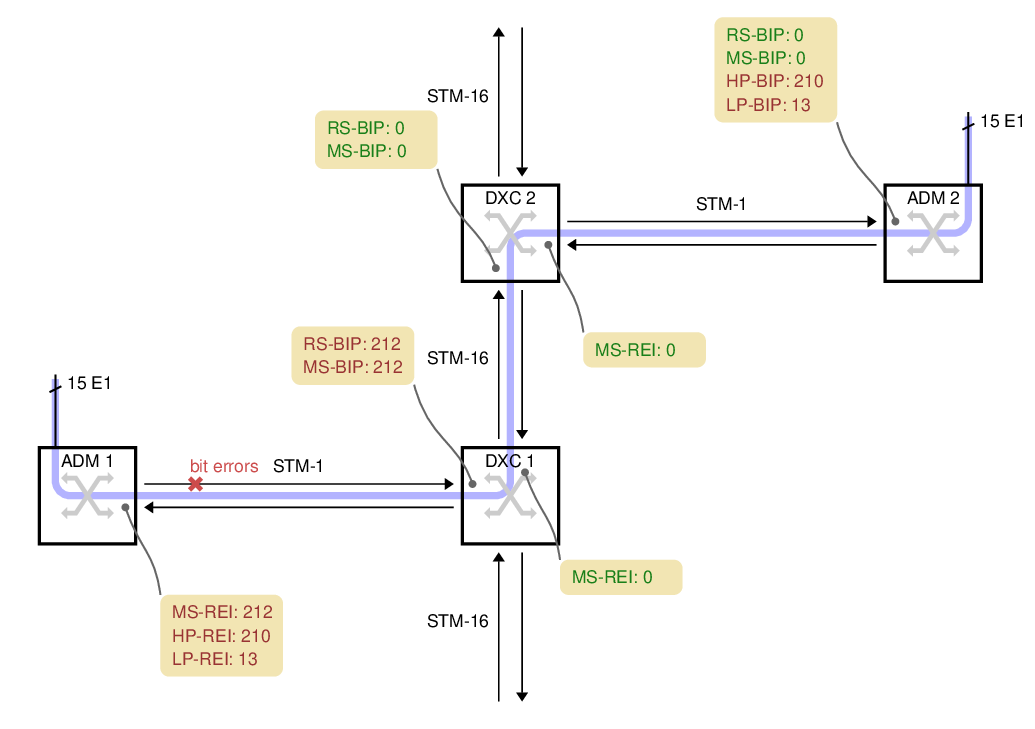
ADM 1
ADM 1 picks up 15 electrical E1s and packs them into 15 VC-12 containers. The VC-12s are packed into a VC-4 and transmitted over a 155 Mbit/s STM-1 optical link towards the operator's core network.
For this case, we're assuming the fiber between ADM 1 and DXC 1 has a problem which causes bit errors. The problem spot is marked with a red cross on the fiber. DXC 1 is in the best position to detect those bit errors since it is directly connected to the fiber with the problem.
DXC 1
DXC 1 is a high-capacity digital cross-connect which can forward data to the operator's 2.5 Gbit/s STM-16 ring. Some manufacturers abbreviate digital cross-connect system to DXC, others use DCS.
The DXC counts two types of parity errors on the incoming fiber: RS-BIP and MS-BIP (Regenerator Section and Multiplex Section Bit Interleaved Parity). Both count an estimate of the number of bit errors in (almost) the whole STM-1. In this example, 212 errors have been detected by both counters, the diagram shows them in yellow boxes.
DXC 1 also transmits the error counts back to ADM 1, as remote error indication (REI) values. They are shown in the yellow box below each node.
DXC 2
DXC 2 cannot report any transmission errors. The DXC's switching granularity is a whole VC-4, so it never unpacks the VC-4 or VC-12s to check the BIPs. DXC 2 just forwards an exact copy of the incoming VC-4.
ADM 2
ADM 2 unpacks both the VC-4 and all 15 VC-12s, so it can report the HP-BIP (High-order Path, Bit Interleaved Parity) and the LP-BIP (Low-order Path) errors. In this example, 210 errors were detected in the HP-BIP and 13 in the LP-BIP.
A more complicated example: case 2
In this example, two ADMs are connected in series on the left, with each one attaching several E1s to the SDH network:
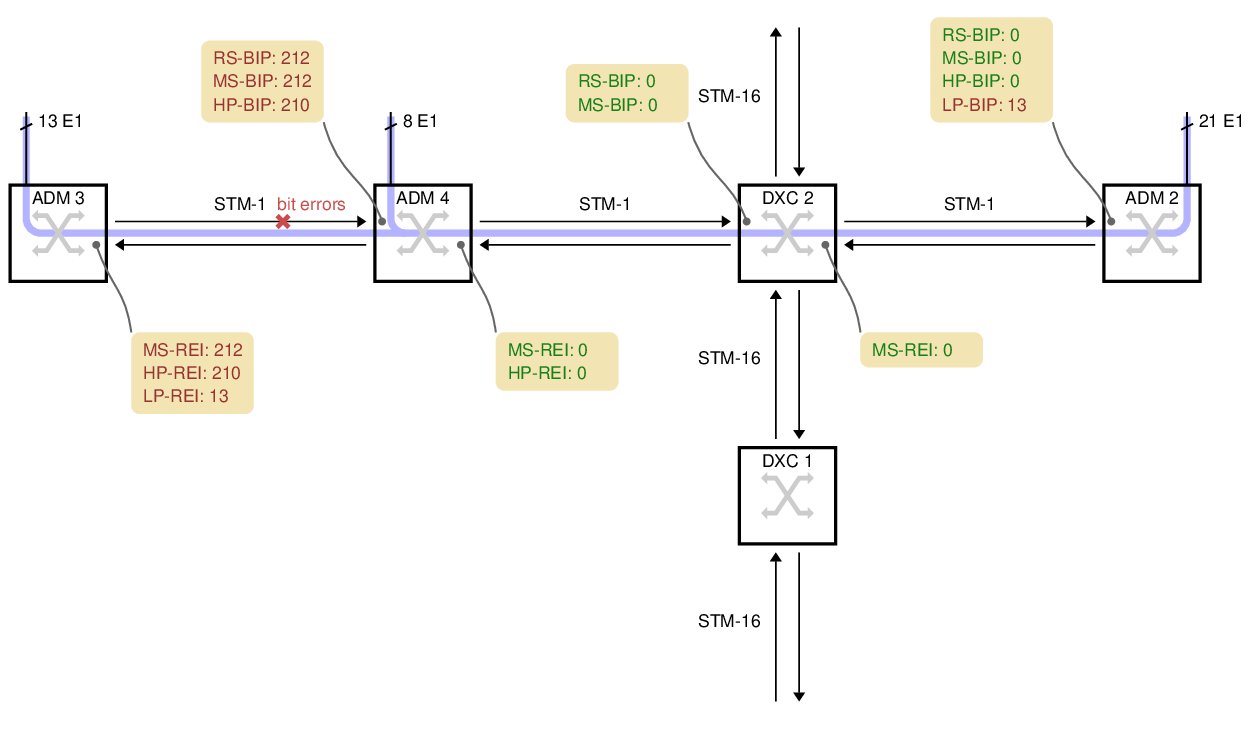
ADM 3 has 13 E1s which it sends rightwards. For this example, the bit errors are on the fiber between ADM 3 and ADM 4, marked with a red cross.
ADM 4 has a further 8 electrical E1s. It unpacks the 13 VC-12s from ADM 3, adds the 8 new VC-12s, makes a new VC-4 and transmits the result to DXC 2.
DXC 2 cannot report any errors because it just copies the incoming VC-4.
ADM 2 unpacks all 21 E1s, so it can see that 13 of the LP-BIP counters have errors, but 8 do not. Armed with a map of the network, this is often enough information to deduce where the problem is. There are no HP-BIP errors, however, because the VC-4 arriving here was made by ADM 4, whereas the transmission errors happened before ADM 4.
Practical Complications
All ADMs and DXCs are capable of counting the number of BIP errors down to the level above their switching granularity. But actually finding the value in the manufacturer's command-line or GUI is not always easy. On Corelatus equipment, the values are displayed on the on-board HTTP server, under SDH. They are also available via the CLI and API.
The names for the BIP error counters vary from manufacturer to manufacturer. Sometimes, the counter is named after the byte in the SDH frame the counters are carried on, i.e. B1, B2, B3 and V5 correspond to RS-BIP, MS-BIP, HP-BIP and LP-BIP, respectively.
When Corelatus equipment is used with SONET, it reports the counters using the standard SONET names, e.g. REI-L for what would be called MS-REI in SDH.
Using an optical splitter, you can always connect a Corelatus SDH Monitor 3.0 to an STM-1 link and see the BIP and REI counters at all levels. That provides more information about errors than just looking at a DXC's counters, partly because the Corelatus system can report BIP errors all the way down to VC-12 and partly because the Corelatus system can decode and record the data on E1/T1 timeslots. In case 2, the DXC does not report the LP-BIP errors because the DXC has no reason to unpack the VC-12s it is carrying, but a Corelatus system connected any of fiber links along the whole transmission path will report the LP-BIP errors and, optionally, decode SS7 or other signalling on individual E1 timeslots.
Permalink | Tags: GTH, telecom-signalling, SDH and SONET
Decoding random data
Posted March 13th 2015
If you were to feed a timeslot random data and try to decode that as though it were MTP-2, how long would it take until you get a valid packet?
(Quick answer: it'll happen about once every week or two on a regular 64kbit/s link.)
What does it take for a packet to be valid MTP-2?
If we send random data, then every so often there's going to be a flag. That signals start- and end-of-packet for MTP-2, so random data will look like it has packets. But to get valid packets, there are several more hoops to jump through:
- The CRC must be right.
- The packet must be a multiple of 8 bits long, e.g. 31 bit packets aren't allowed.
- The length indicator must be right.
- The packet must be between 5 and 272 octets (bytes) long.
It's possible to calculate how often all of those requirements are met...but it seems easier and less prone to "oh, I didn't think of that" to just try it and see what happens.
Test setup
I used a Corelatus E1/T1 Messenger 2.1 with a crossover E1 cable so that everything it transmits on one E1 port is received on another. I didn't write any code to do this, I just used programs from the C sample code collection, like this:
      $ ./playback_file 172.16.2.7 3A 1 /dev/urandom
      // in another window
      $ ./save_to_pcap 172.16.2.7 4A 1 /tmp/random.pcap
Results
After about 12 hours, the MTP-2 counters looked like this:
| Interface | Timeslot | Status | MSUs | ESUs | FISUs | LSSUs | Load % |
|---|---|---|---|---|---|---|---|
| 4A | 1 | no signal units | 3 | 10964728 | 0 | 0 | 0 |
We got 11 million bad packets and 3 good ones and no FISUs. Looking at the "good" ones more closely, it's obvious that they're not good either. Here's one of them:
      $ tshark -x -r /tmp/random.pcap | tail -2
      0000  9e e2 49 ef a1 95 0f b0 7a 34 b6                  ..I.....z4.

      $ tshark -V -r /tmp/random.pcap
      Frame 3: 11 bytes
      Interface id: 0 (4A:1)
      Encapsulation type: SS7 MTP2 (42)
      Arrival Time: Mar 13, 2015 11:36:56.057000000 CET
      Message Transfer Part Level 2
      .001 1110 = Backward sequence number: 30
      1... .... = Backward indicator bit: 1
      .110 0010 = Forward sequence number: 98
      1... .... = Forward indicator bit: 1
      ..00 1001 = Length Indicator: 9
      01.. .... = Spare: 1
      Message Transfer Part Level 3
      Service information octet
      11.. .... = Network indicator: Reserved for national use (0x03)
      ..10 .... = Spare: 0x02
      .... 1111 = Service indicator: Spare (0x0f)
      Routing label
      .... .... .... .... ..01 0101 1010 0001 = DPC: 5537
      .... 0000 0000 1111 10.. .... .... .... = OPC: 62
      1011 .... .... .... .... .... .... .... = Signalling Link Selector: 11
      Data: 7a34b6
Two things aren't quite right. First, the spare bits are normally set to zero (but Q.703 doesn't require this). Second, the length indicator is 9, but should be 6 for this packet (Q.703 requires checking this; Corelatus GTH accepts it anyway to make it easier to debug installations which use extended sequence number format).
Permalink | Tags: GTH, telecom-signalling, SDH and SONET
Daisy-chaining SDH/SONET interfaces
Posted October 27th 2014
SDH/SONET Monitor 3.0 has a daisy-chain feature which lets you retransmit the incoming signal. This is useful in two situations. The first is scaling layer-2 decoding capacity by adding more decoding hardware. The second is monitoring without an optical tap---'intrusive' monitoring.
Ad-hoc daisy-chaining
An earlier post briefly mentioned daisy-chaining. We'll look at the same site: it has three SDH links, S1, S2 and S3. Each link is tapped with an optical splitter. It looks like this:
Each optical link in the example carries 10 LAPD timeslots per E1, that's fairly typical on Abis links. One STM-1, the one labelled 'S2', is fairly uninteresting because it only carries 300 channels of signalling:
15 E1s x 2 directions x 10 timeslots = 300 simplex channels
one submodule of an SDH/SONET Monitor 3.0 can decode all of that.
The STM-1 labelled 'S1', however, carries 500 channels of signalling, which is more than the 320 channels one submodule can decode:
25 E1s x 2 directions x 10 timeslots = 500 simplex channels
The solution is to re-transmit the incoming signal to another submodule. That's what the blue lines in the diagram show. We added a short fiber going from one sub-module to another. That lets us process 320 of the 500 channels on one submodule and 180 on the other.
Symmetric daisy-chaining
I called the daisy-chaining scheme above "ad-hoc", because it fairly arbitrarily copies some directions of some links to another submodule but leaves others alone. There's a second way to do daisy-chaining. Here's an example:
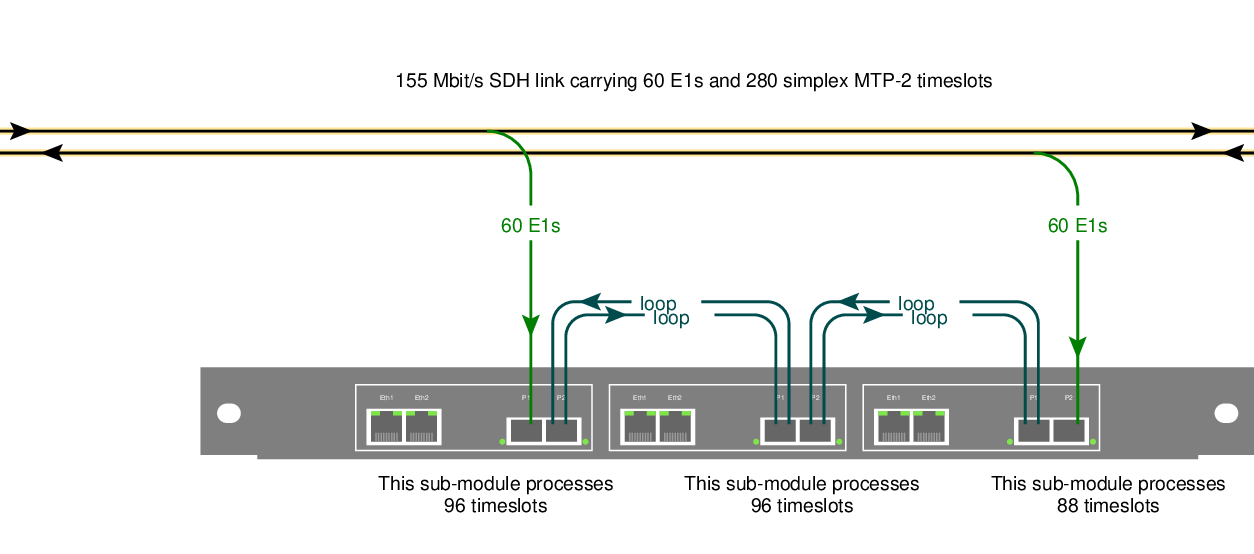
The idea is to feed each direction of a link into a separate submodule, and then copy both directions to a chain of submodules using short fiber cables. In this example, I've shown a chain of three subsubmodules.
Symmetric daisy-chaining lets every sub-module in the chain see all input. You can freely choose which sub-module in a chain processes which signalling channels---e.g. you might want to process the two directions of one signalling link on the same submodule.
The upside of symmetric daisy-chaining is that it's conceptually cleaner: every submodule in a chain sees all of the input.
The downside: symmetric daisy-chaining requires more fibers and in some situations also more hardware.
Intrusive monitoring
Normally, Corelatus hardware connects to optical networks via an optical tap. That way, you can be confident that the monitoring equipment won't disturb the live link.
With daisy-chaining, you also have the option of routing a live signal through the SDH/SONET monitor 3.0, i.e. you don't need an optical splitter. That's particularly useful in situations where briefly interrupting a link is acceptable, e.g. during a site survey or while debugging.
N.B.: daisy-chaining stops working when the power is off! That's why we use optical splitters for permanent installations.
How to set up daisy-chaining
Daisy-chaining always works cross-wise, i.e. a signal coming in on P1 (the leftmost SFP) will come out on P2. Daisy-chaining is off by default. Here's how to enable it:
    <enable name='sdh1'>
      <attribute name='daisy_chain' value='true'>
    </enable>
Here's what the same command looks like from the CLI:
    GTH CLI started. 'help' lists commands
    gth 172.16.1.34> enable sdh1 daisy_chain true
    ok
Permalink | Tags: GTH, telecom-signalling, SDH and SONET
Dimensioning SDH/SONET monitoring
Posted February 27th 2013
Updated 6. February 2018 because of capacity improvements in hardware shipped from this date onwards. This affects the LAPD capacity calculation.
This post is an example of how to figure out how much hardware you need to monitor all the Abis signalling at a GSM site which uses STM-1 to transport E1 lines.
The site
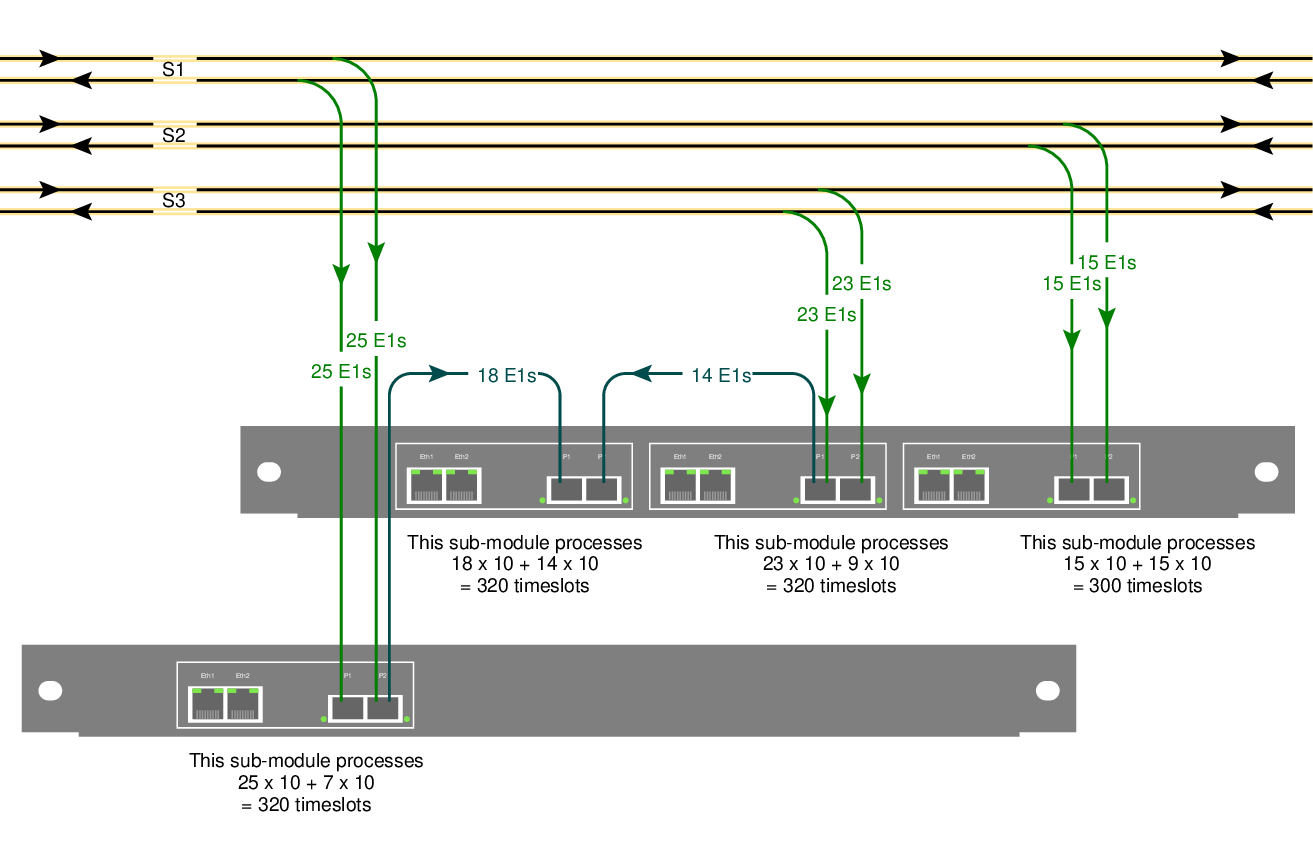
The site we're looking at, a BSC, has STM-1 connections to three BTSs: S1, S2 and S3. They have 25, 15 and 23 E1s on them. Here's how we set it up:
The yellow lines at the top are the original 155Mbit/s STM-1 links going from the BSC to each BTS. There's one fiber for each direction.
The green lines are the output of the fiber taps. They're an optical copy (typically taking 10% of the light) of the original STM-1. Each link has two taps, one for each direction. For this example, we'll assume that the application needs the signalling from both directions.
The blue lines are fibers going from one SDH/SONET probe's sub-module to another. That lets us shift processing load from one sub-module to another.
Ports and modules on Corelatus' SDH/SONET probe
There are two models of the SDH/SONET probe.
The lower one in the diagram is the low-end model: it has one sub-module. A sub-module has two SFP sockets and two ethernet ports. The SFP sockets accept SFP modules which connect to the optical lines (green).
The upper one in the diagram is the full model: it has three sub-modules.
Layer 2 (LAPD) signalling
For this example, I've assumed that we're interested in 10 timeslots of LAPD signalling on each E1. That's the worst-case in normal GSM installations. In practice, there can be fewer signalling timeslots, either because BTSs are daisy-chained or because the BTS doesn't have the maximum number of radio transceivers.
Each submodule can decode 400 LAPD channels. Link S1 has 25 x 2 x 10 = 500 LAPD channels, so one submodule can't process them all. We handle that by running a fiber to the next sub-module. That way, 25 + 7 E1s are handled on the first submodule and the remaining 18 on the next sub-module.
UMTS
On 3G networks, the signalling is often carried as ATM, either directly on STM-1 (or OC-3) or inside E1 lines carried on STM-1. The principles for dimensioning are the same, but the numbers are different.
Permalink | Tags: GTH, telecom-signalling, SDH and SONET
Configuring SDH/SONET
Posted January 30th 2013
Today, I'm going to walk through setting up a Corelatus SDH/SONET probe to look at E1/T1 lines carried on 155 Mbit/s SDH/SONET.
A quick look at SDH/SONET
Wikipedia has a good article about SDH/SONET. SONET is the standard mostly used in North America, SDH is the one mostly used in the rest of the world. The differences between the two are minor, for Corelatus' hardware it's just a setting in software.
SDH/SONET can both be used to carry various types of data. This time around, we'll just look at the E1/T1 lines. Here's a diagram of the scheme SONET uses to pack many E1/T1 lines into one 155 Mbit/s line, usually an optical fiber:
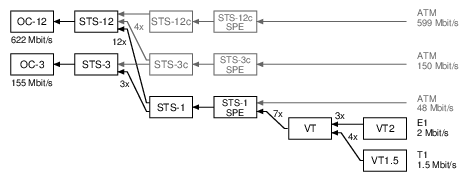
SONET calls the 155 Mbit/s line an "OC-3" (on the left of the diagram). SONET then has three layers of packing lines together (STS-1, VT, VT2), and that allows it to fit 3 x 7 x 3 = 63 E1 lines or 3 x 7 x 4 = 84 T1 lines.
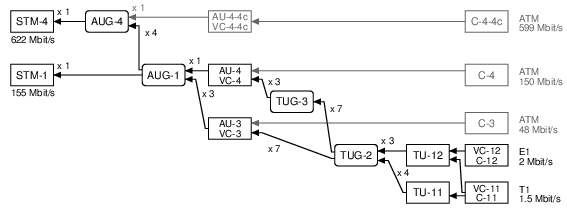
SDH uses different names for similar ideas. The end result is the same: it carries 63 E1s or 84 T1s:
To work with E1/T1 lines on a Corelatus SDH/SONETs Monitoring Probe, we need to do three things:
- Turn on (enable) SDH/SONET at the top level
- Obtain (map) a name for a particular E1/T1 line
- Turn on (enable) layer 1 processing on the E1/T1 line
Setting up SDH/SONET using the API
Same as all other Corelatus probes, the SDH/SONET probe responds to text commands sent over TCP port 2089. To support SDH/SONET, we added two new comands enable and map.
First, enable SDH/SONET at the top level, in SONET mode for this example:
  C: <enable name='sdh1'><attribute name='SONET' value='true'/></enable>
  G: <ok/>
Once sdh1 is enabled, you can walk through the containers carried on it using the query command. But we'll skip right to mapping one of the E1 links:
    C: <map target_type='pcm_source'>
          <sdh_source name='sdh1:hop2:lop7_4'/></map>
    G: <pcm_source name='pcm60'/>
Now that we know what name the E1 has (pcm60 in this example), we can enable L1 using the same command you'd use on a probe with an electrical E1:
    C: <enable name='pcm60'><attribute name='mode' value='T1'/></enable>
    G: <ok/>
After these three commands, you have a T1 which is ready to use just like a T1 on other Corelatus hardware, i.e. you can start layer 2 decoding on it, or copy out the data or...
The API manual goes into detail, with more examples, including how to use disable and unmap.
Setting up SDH/SONET using the CLI
The SDH/SONET probe has a command-line interface. It's useful for experimenting and exploring. Here's how to set up things the same as above:
    $ ssh cli@172.16.2.9
    cli@172.16.2.9's password: (mail matthias@corelatus.se)
    GTH CLI, press Enter to start (^D to exit)

    GTH CLI started. 'help' lists commands
    gth 172.16.2.9> enable sdh1 SONET true
    ok
    gth 172.16.2.9> map sdh1:hop2:lop7_4
    Mapped to: pcm60
    ok
    gth 172.16.2.9> enable pcm60 mode T1
    ok
Setting up SDH/SONET using Python
Corelatus has sample code in a few languages, including Python, which shows how to use the API to set up an SDH link just like above. Here's the python demo program doing the same thing:
    $ ./gth.py enable 172.16.2.9 sdh1 SONET true
    $ ./gth.py map 172.16.2.9 sdh1:hop2:lop7_4
    pcm60
    $ ./gth.py enable 172.16.2.9 pcm60 mode T1
The C and Erlang sample code (on the same page) provides the same functionality, but with slightly different syntax.
Permalink | Tags: GTH, python, SDH and SONET